About DATA:
Debit & Credit Card Transaction Data: Ultimate Buyer’s Guide
Learn how to evaluate and use debit and credit card transaction data in your business.
What Is It?
Real World Uses
Key Considerations
Introduction
Every time a consumer swipes a debit card at a gas station or taps a credit card to buy a pair of sneakers online, they leave behind a powerful digital breadcrumb: a transaction. When aggregated and anonymized at scale, debit and credit card transaction data becomes a living, breathing map of the economy.
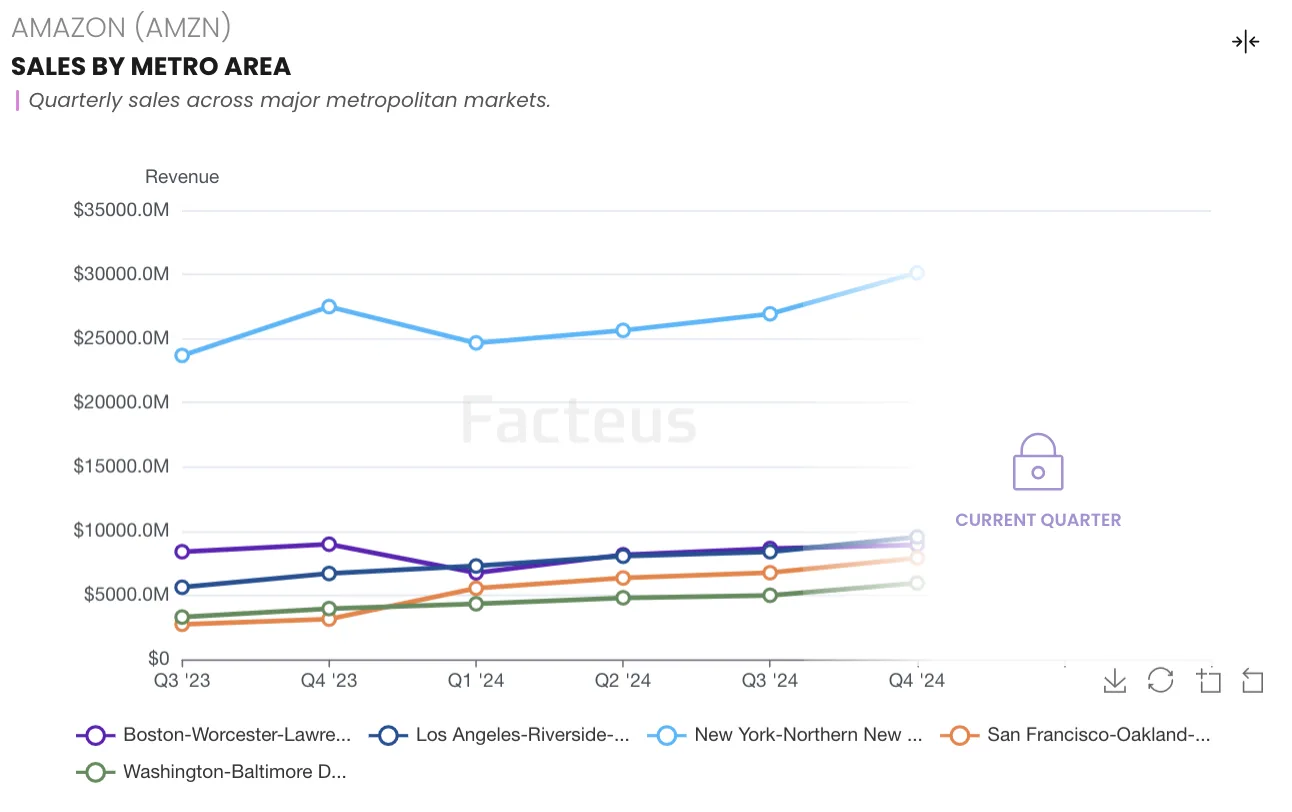
Example: Macroeconomic Trends from Consumer Spend Data
Total Consumer Spending
Year-over-year growth in retail sales excluding auto
Durable vs Non-Durable Goods
Comparison of durable and non-durable goods performance
Whether you’re an investor seeking alpha, a retail strategist benchmarking performance, or an AI team training models on real-world behavior, card transaction data offers unparalleled visibility into how money flows, where it flows, and why it moves. This guide breaks down everything you need to know about debit and credit card data, its use cases, providers, challenges, and how to get the most from it.
What Is Debit and Credit Card Transaction Data?
Card transaction data is the digital record of purchases made using debit or credit cards. It includes anonymized information about:
- Transaction Amount: The dollar value of the transaction, which is foundational to trend analysis, revenue forecasting, and economic modeling.
- Timestamp: The precise date and time of the transaction, enabling daily, weekly, or even intraday views of spending patterns.
- Merchant Name or Category: The brand or classification of where the purchase took place, providing insight into sector-level dynamics, share of wallet, and competitive benchmarking.
- Location (ZIP, City, State): Geographic tagging that allows for hyper-local insights, regional trend tracking, and market-entry planning.
- Channel (In-store vs. Online): The mode of transaction which reveals shifts in consumer behavior, omnichannel effectiveness, and digital adoption rates.
- Payment Method (Credit, Debit, Prepaid, etc.): A breakdown of how consumers or businesses are choosing to pay, which can signal financial confidence or liquidity constraints.
Some providers also include more granular details, such as SKU-level product data, B2B transaction data, and demographic segmentation, unlocking deeper behavioral and product-level insights.
Example: Demographic Spend Data
Consumer Spending by All Demographics
Combined view of consumer spending across generation, income, and region
How Card Transactions Work
Each card transaction flows through several distinct steps:
- Authorization: The purchase request is initiated and routed from the merchant through the payment processor and card network to the issuing bank for approval.
- Clearing: The transaction details are sent to all parties to validate and prepare for settlement.
- Settlement: Funds are transferred from the cardholder’s bank to the merchant’s bank, completing the transaction.
These stages involve multiple entities: the cardholder, merchant, acquirer, issuer, and payment network. Each one leaves a data trail that contributes to a rich, structured data signal that—when anonymized and aggregated—can illuminate trends, behaviors, and benchmarks.
Understanding how card transactions flow through the ecosystem is just the foundation. The real value emerges when this data is applied across verticals—helping businesses anticipate demand, benchmark performance, and make data-informed decisions in real time. Here’s how different teams—from Wall Street to Main Street—are using it today.
Who Uses Card Transaction Data (and Why)?
Institutional Investors
Institutional investors use card transaction data to generate early signals and sharpen their investment models. By analyzing real-time spend trends, they can anticipate earnings surprises well before they are reported publicly. This provides a competitive edge in capital markets, enabling alpha generation from information that hasn’t yet been priced in. Additionally, tracking daily or weekly consumer behavior offers unique insight into broader macroeconomic indicators—like inflation shifts, category rotation, and trade-down behavior—which traditional datasets can miss.
Why it matters: Alpha depends on seeing the turn before the rest of the market does. Card data offers that early signal.
2. Retail & QSR Brands
Retailers and quick service restaurants rely on transaction data to benchmark performance against competitors, evaluate the impact of promotions, and inform store placement and expansion strategies. With store-level granularity, brands can monitor performance down to the physical location, identify underperforming sites, and localize promotional tactics. This data also enables strategic decision-making for geographic targeting and channel strategy (in-store vs. online).
Why it matters: Location-level intelligence drives better marketing, better site placement, and better financial outcomes.
CPG and E-Commerce Companies
CPG brands and digital-first sellers use card transaction data to track market share by SKU or category, understand customer channel preferences, and uncover cross-shopping behaviors. By analyzing basket composition and trip sequencing, marketers and category managers can better position their offerings, spot substitution threats, and design targeted product bundles. These insights are also key inputs for demand forecasting and trade optimization.
Why it matters: In an omnichannel world, understanding what your shopper buys next—and where—is your edge.
Ad-Tech and Audience Builders
Ad-tech platforms and agencies tap card transaction data to construct syndicated and custom audiences grounded in verified purchasing behavior. This enables sharper targeting, more relevant creative, and better media allocation. Lookalike modeling based on actual spend—rather than inferred interests—leads to significantly higher conversion rates. And with closed-loop measurement capabilities, marketers can attribute ad exposure to real sales across both online and in-store channels.
Why it matters: Ad budgets demand ROI. Spend-based targeting is the surest way to get it.
AI and Data Science Teams
Data scientists and AI teams use card transaction data to feed behavioral models, fine-tune personalization engines, and simulate economic scenarios with greater realism. Because card data reflects what people and businesses actually do—not what they say or click—it offers unparalleled training signal for LLMs, recommendation systems, and risk models. It’s also increasingly valuable for building synthetic consumer personas and real-world reinforcement learning environments.
Why it matters: Better models start with better signal—and card data is one of the truest signals of real-world behavior.
How Organizations Use Card Data in Practice
While card data is commonly associated with high-level analytics, it’s increasingly embedded into day-to-day workflows. From real-time decisioning to long-term forecasting, organizations extract value in two major modes:
Operational Applications
Used by merchandising, marketing, and fraud teams, operational uses center on immediate decision-making. For example: dynamically adjusting ad spend based on purchase spikes, or automating fraud detection with real-time pattern recognition.
Analytical Applications
Executives and strategists lean on transaction data to make quarterly and annual decisions. That includes benchmarking against competitors, running category trend analysis, and forecasting performance based on historical spend and seasonality.
Types of Card Transaction Data
Consumer Spend Data (B2C)
Data that reflects real-time purchases made by individuals using debit, credit, or prepaid cards. It captures everyday transactions—grocery runs, retail purchases, restaurant visits—and is crucial for understanding consumer behavior, sentiment, and trade-offs.
Commercial Spend Data (B2B)
This segment captures transactions from business and corporate cards. It enables insights into vendor relationships, procurement trends, and spending cycles across industries. B2B spend intelligence is particularly valuable for supply chain visibility and business benchmarking.
UPC-Level Data
Instead of only showing the merchant name, UPC-level data (or SKU data) reveals exactly what was purchased (e.g., product name, quantity, price). This detail supports granular analyses like product affinity, promotional lift, and cannibalization, offering a window into consumer choice at the item level.
Benefits of Card Transaction Data
Historical Depth
Robust transaction datasets should include years of historical data to support long-term trend analysis, baseline comparisons, and year-over-year growth insights. With access to pre-COVID benchmarks and multi-year context, organizations can distinguish structural changes from short-term anomalies. This is especially useful for strategic planning, budgeting, and forecasting use cases.
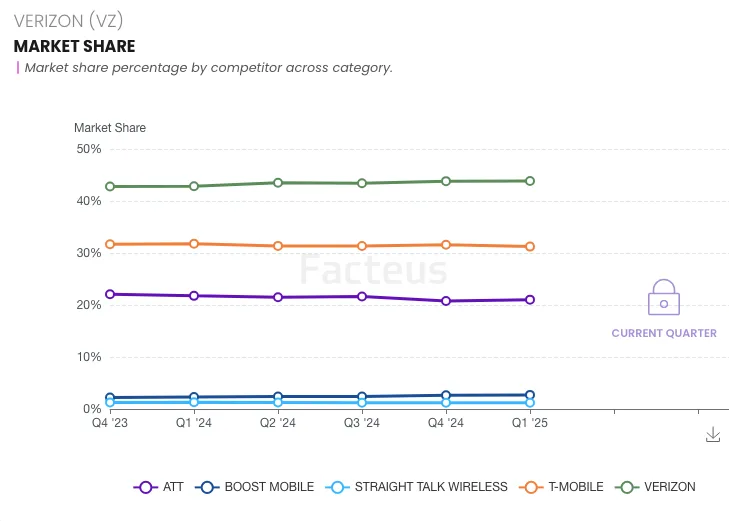
Benchmarking & Multi-Ticker Comparison
Transaction data allows users to compare spend trends across brands, categories, or tickers. Whether it’s tracking the share of wallet between Home Depot and Lowe’s, or observing competitive pressure between e-commerce and brick-and-mortar channels, cross-brand comparisons are made possible through a shared taxonomy and structured panels.
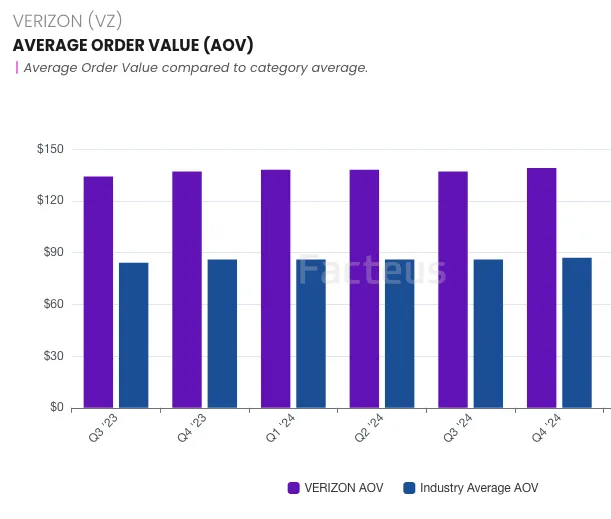
Example: Average Order Value Benchmark data
Emerging Category & Product Trendspotting
At the SKU and product-category level, transaction data can highlight the early growth of breakout segments. Brands can identify trade-down behaviors (e.g. from premium to discount), spot new consumption patterns (e.g. non-alcoholic beverages), and track cannibalization or halo effects when launching new products or promotions.
Example: Category Trend Data
Sector Spend
| May '25 | Jun '25 | Jul '25 | Aug '25 | Sep '25 | Oct '25 | |
|---|---|---|---|---|---|---|
| Retail Sales ex. Auto | -0.06% | 0.18% | 4.69% | 5.33% | 4.52% | 9.61% |
| Building mat. and garden equip. and supplies dealers | 0.82% | -5.07% | 1.41% | 1.54% | -5.31% | -2.93% |
| Clothing and clothing access. stores | -0.38% | 0.71% | 4.51% | 6.42% | 2.80% | 9.12% |
| Electronics and appliance stores | -18.56% | -0.71% | -2.43% | -0.12% | 2.56% | 12.86% |
| Food and beverage stores | 0.93% | -0.43% | 3.88% | 5.88% | 3.91% | 8.64% |
| Food services and drinking places | 5.26% | 0.57% | 7.17% | 6.88% | 5.47% | 10.93% |
| Furniture and home furnishings stores | 2.98% | 5.88% | 3.03% | 8.84% | 1.34% | 8.78% |
| Gasoline stations | -8.00% | -3.57% | -1.21% | 0.14% | 6.05% | 7.79% |
| General merchandise stores | 0.27% | 2.08% | 2.44% | 4.50% | 1.80% | 8.37% |
| Health and personal care stores | 3.66% | 3.85% | 11.50% | 6.21% | 9.39% | 12.17% |
| Miscellaneous store retailers | -9.06% | -5.14% | 6.05% | -9.86% | -6.22% | 5.86% |
| Nonstore retailers | 0.53% | 1.96% | 7.30% | 5.87% | 8.15% | 14.07% |
| Sporting goods, hobby, musical instrument, and book stores | -1.47% | 0.01% | -3.44% | 9.21% | 13.57% | 11.27% |
Speed
Unlike traditional sales reporting or survey data, card transaction data updates daily or within 1–2 days. This near real-time access provides an early signal advantage for analysts, marketers, and decision-makers responding to fast-moving trends.
Coverage
With billions of dollars in spend data across every U.S. ZIP code, every retail category, and both B2C and B2B contexts, card data captures a comprehensive view of the economy—from high-frequency micro-transactions to large corporate purchases.
Accuracy
This is ground-truth data based on actual purchase behavior—not inferred intent or modeled estimates. Every transaction represents a verifiable action taken by a consumer or business.
Granularity
Data can be segmented by merchant, region, store, SKU, payment method, and even time of day. This level of granularity enables precise analysis across multiple dimensions.
Anonymity
Well-sourced card data is privacy-first by design. It is anonymized and aggregated to ensure no personally identifiable information (PII) is ever exposed, while still enabling robust behavioral analytics.
Privacy, Security & Compliance
Anonymization & Aggregation
Best-in-class providers never touch PII. Instead, they use synthetic or tokenized data structures to ensure that insights are drawn from fully anonymized records that pose no privacy risk.
Regulatory Compliance
Top providers operate in compliance with data privacy regulations such as GDPR, CCPA, and GLBA. This includes transparent sourcing, data governance audits, and contractual controls over how data can be used.
Ethical Use
Ethical data usage extends beyond compliance. Providers must avoid gray-zone practices like scraping inbox receipts or using opt-in apps with vague consent policies. Buyers should verify that the provider’s panel is consented, permissioned, and contractual.
Data Stewardship
Strong providers take on the burden of data normalization, enrichment, and maintenance. This includes merchant name cleaning, demographic overlaying, and monitoring data drift or signal quality degradation over time.
Challenges & Considerations
Data Quality & Normalization
Without normalization, transaction records are messy and difficult to analyze accurately. Look for providers that deliver merchant mapping, SKU resolution, and de-duplication out of the box. Clean, structured data saves weeks of engineering time and avoids downstream analytics errors.
Panel Bias & Representativeness
Some providers skew heavily toward specific card types, income levels, or geographies. Ensure the panel reflects the full economic spectrum—credit, debit, prepaid; high-income and low-income; urban and rural. This balance matters for statistically robust insights and accurate segmentation.
Data Freshness & Recency
If you’re modeling short-term behavior, a 1–2 day lag matters. Some providers deliver data with 5–7 day delays or only update weekly, which weakens predictive edge. Investors and AI teams building high-frequency models need timely updates to stay ahead.
B2B vs. B2C Visibility
Not all providers capture both consumer and commercial card activity. Choose a dataset aligned with the segment you’re targeting—consumer behavior, vendor procurement, or enterprise spend. Dual visibility unlocks unique insights, like how consumers and businesses respond differently to the same macroeconomic trend.
Depth of Coverage per Entity
Are you seeing just one card from a user’s wallet, or do you have multi-card visibility? The closer you get to a 360° picture of the consumer or business, the stronger your segmentation and modeling becomes. Depth drives accuracy, especially for churn modeling and behavioral prediction.
Store-Level & SKU-Level Tagging
Some providers only resolve transactions to ZIP code or DMA level, missing insights on which store was visited or what was actually purchased. Store-level tagging enables localized benchmarking, while SKU-level detail reveals consumer preference and product performance.
Panel Stability Over Time
How frequently does the panel churn? Data from cards (which people rarely change) tends to be more stable than panels based on mobile apps or browser extensions. A consistent panel ensures trend continuity and reduces the need for frequent rebaselining.
Ease of Use / Pre-Paneling
Does the provider offer fully pre-paneled data with merchant-level normalization, demographics, and trend indices—or are you starting from raw, unmapped data requiring a data science team to activate it? Pre-paneling accelerates adoption, improves usability, and makes insights accessible across an organization.
Delivery Format & Activation Readiness
Evaluate how the data is delivered: raw feeds, structured APIs, or insight-ready dashboards. Corporates may prefer turnkey dashboards with benchmarking modules, while quant funds might need low-latency API access. The ability to choose delivery format based on internal skill sets and workflows is critical to ROI.
Compliance Risk
Ensure data never includes PII or sensitive information. Providers relying on opt-in loyalty apps or scraped emails may pose greater legal exposure than synthetic or masked datasets. Synthetic data partnerships and tokenized identifiers reduce regulatory friction.
Data Partner Security & Exclusivity
Look for long-term, exclusive partnerships between the data provider and its sources. Single-sourced vendors with shared panels introduce risk—your competitors may be buying the exact same feed. Facteus maintains exclusive relationships with over 20 issuers and processors, minimizing that risk.
How to Choose a Card Data Provider
Source Diversity
A robust card data provider should aggregate from a variety of sources—banks, card processors, and issuers—to reduce the risk of single-panel bias and ensure holistic coverage. This diversity directly affects how representative and resilient the data is to changes in any one source.
Data Freshness
Speed matters. Some use cases—like daily model training or near-term earnings prediction—demand data that refreshes within 24–48 hours. Providers that delay updates by 5–7 days lose relevance in high-velocity workflows and fail to offer early insight advantages.
Granularity
From merchant- to SKU-level, the depth of resolution determines the precision of your insights. If you’re evaluating product-level demand shifts, you’ll need SKU granularity. If you’re analyzing store performance, look for providers offering location-level (not just ZIP or DMA) tagging.
Use Case Alignment
Some data sets are better suited for investor alpha models; others are built for brand benchmarking or audience segmentation. A good provider delivers data structured, normalized, and enriched to support your specific application—whether it’s in a dashboard, an API, or a raw data feed.
Credibility
Trust signals matter. Choose providers with a proven track record, transparent sourcing, strong client references, and secure long-term partnerships. Look for published case studies and signs of institutional adoption by hedge funds, large corporates, or major platforms.
Facteus: A Leader in Real-World Spend Intelligence
Facteus provides access to billions in debit, credit, and corporate card transactions through our MIMIC and MÖBIUS platforms. Unlike other providers that infer behavior from proxies like foot traffic or search data, we offer ground-truth insights from actual purchases.
Real-time data (1-day lag)
Access to both B2C and B2B card transactions
SKU-level and store-level visibility
Syndicated dashboards and custom analytics capabilities
Industry-leading privacy, compliance, and partner exclusivity
Whether you’re a hedge fund quant, a retail CFO, or a data-driven CMO, Facteus helps you see what’s happening in the economy right now—before it shows up in earnings calls or board decks.
Getting Started
Want to explore how debit and credit card transaction data can drive smarter decisions? Start with a conversation.