Learn how to evaluate and apply product-level competitive sales data in your business.
Real World Uses
Key Considerations
Common Pitfalls
1. Why Product-Level Data Is No Longer Optional
If you’re still looking at brand-level trends to understand CPG performance, you’re missing the story. Market shifts are being driven by changes at the product level: consumers choosing one UPC over another because of pricing, size, channel, promotion, or convenience. With inflation, shrinkflation, and endless product proliferation across in-store and digital shelves, companies need visibility into what’s actually being bought—not just what’s shipped or displayed.
UPC-level data allows you to capture market share battles in real time. Whether you’re tracking the early success of a new product launch, understanding how a price promotion altered sales velocity, or spotting trade-down behavior across income groups, product-level data gives you an edge. In a world where a few days of insight delay can result in missed revenue, excess inventory, or mispriced equities, having access to SKU-specific signals isn’t a luxury—it’s foundational. This granularity isn’t just useful; it’s required to power AI models, train marketing automation engines, and trigger supply chain decisions.
Example: Sales and Transaction Volume:
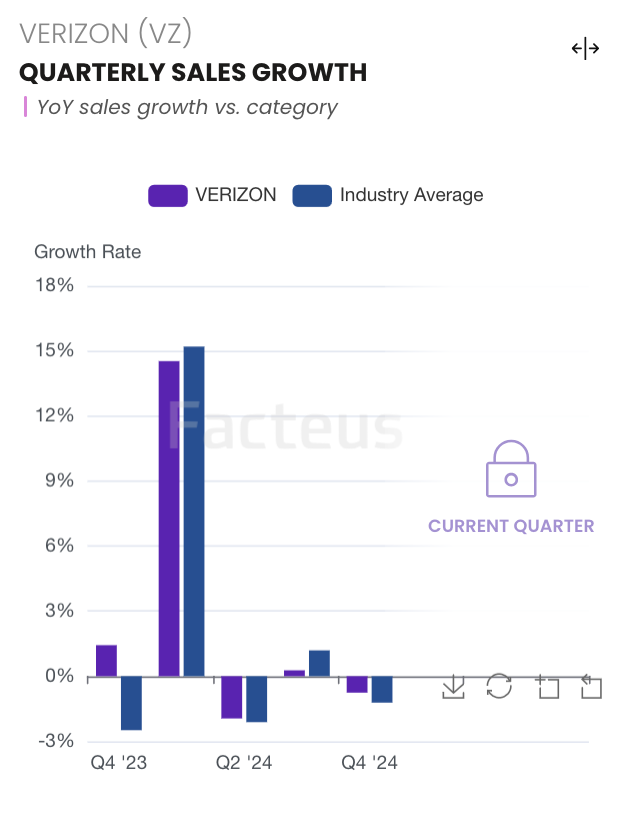
Get detailed insights into the key revenue drivers for any brand:
2. 7 Critical Capabilities to Demand in Product-Level Data
Not all datasets are created equal. Below are seven non-negotiables that should be part of any evaluation process:
1. Omnichannel Purchase Coverage
You can’t understand a consumer by looking at only part of their behavior. A dataset that omits online or mobile transactions is incomplete by definition. To reflect reality, your data must include not just in-store POS records but also digital receipts, mobile orders, app-based fulfillment, and even delivery platforms. Loyalty cards, email receipts, and alternative checkout methods should all be part of the mix. True omnichannel visibility isn’t a buzzword—it’s the baseline for understanding the full path to purchase.
Ask: Does this dataset include Amazon, Instacart, Walmart.com, and club channel visibility?
2. High-Frequency Refresh & Recency
Weekly updates don’t cut it when decisions are made by the day or hour. Whether you’re a trader, marketer, or forecaster, your data must reflect near real-time activity. Leading providers now update data every 24 to 72 hours, allowing you to react before your competitors even see the trend. This speed becomes especially critical around promotional events, product recalls, seasonality spikes, or macroeconomic shocks. Your signal is only as good as your lag time.
Ask: What is your lag time between transaction and data delivery?
3. Standardized Metrics Across Units & Spend
Raw receipts are messy. A strong dataset must normalize unit counts, pricing, volume, and discounting across retailers and UPC variations. Without consistent definitions, it’s impossible to compare products accurately across geographies or track trends over time. You need to know whether a 10% revenue lift came from increased unit volume, a larger pack size, or a price hike. Clean data enables clean insights.
Ask: Is pricing normalized across pack sizes and UPC variants?
4. Brand, Company & Ticker Mapping
Granular data is powerful—but only if you can roll it up. Being able to map a UPC to its brand, parent company, or publicly traded ticker enables benchmarking, peer analysis, and portfolio exposure modeling. This linkage is crucial for investor use cases, corporate strategy, and vendor performance management. You should never be stuck stitching this together manually.
Ask: Can I roll this up to public companies or vendor hierarchies?
5. Cohort and Segment-Level Intelligence
Not all consumers are created equal. The ability to segment purchasing behavior by income, region, loyalty status, or behavioral pattern transforms basic transaction data into strategic insight. Want to know if younger households are trading down faster? Or which cohort is most responsive to a BOGO campaign? These aren’t fringe questions—they’re at the core of targeting, attribution, and ROI.
Ask: What segmentation dimensions are included or derivable?
6. Delivery Infrastructure & Integration Readiness
Great data is useless if your team can’t access it. Modern organizations need data that fits into Snowflake, S3, APIs, and internal BI pipelines with minimal transformation. You want documented schemas, clear join keys, and the ability to automate updates—not a 300-page PDF and a CSV buried in FTP hell. Integration readiness is no longer a nice-to-have—it’s a requirement for operational scale.
Ask: Can I integrate this data into my internal workflows with minimal lift?
7. Time Series Depth & Coverage Quality
If your provider can’t show you multiple years of history, you’re flying blind. You need depth to understand seasonality, detect long-term shifts, and benchmark performance across years. And breadth matters too: the more stores, channels, and product categories the data covers, the less guesswork you’ll need to do. Precision comes from both historical fidelity and comprehensive coverage.
Ask: How consistent is historical coverage across retailers and regions?
3. Use Cases By Role
Investors
For investors, product-level data unlocks the ability to see micro-signals before they become macro trends. Monitoring SKU-level velocity helps surface winners and losers in a category before those shifts show up in quarterly reports. You can see how a newly launched item performs by region, detect early signs of product cannibalization, or analyze consumer response to price changes by income bracket or store format. More importantly, it enables alpha generation by identifying pricing power, promotional sensitivity, and competitive threats at the most granular level. A promo spike might suggest short-term volume, but consistent velocity across price tiers can reveal sustainable share gains—exactly the kind of edge long/short equity investors are chasing.
FP&A & Strategy
Financial planning and strategy leaders rely on SKU-level visibility to eliminate guesswork. Forecasting becomes dramatically more accurate when it’s based on actual item-level purchase behavior segmented by region, retailer, and cohort. When you can isolate the exact impact of a promotion—down to the dollar lift, unit acceleration, and timing offset—you can model ROI instead of guessing at it. FP&A teams also use this data to spot regional seasonality, measure sell-through by location, and plan assortment changes with confidence. Instead of managing the business by high-level averages, you can drive decisions off real-world, on-shelf performance at the product level.
AdTech & Partnerships
For AdTech leaders and data partnership teams, UPC-level data is gold. It enables real purchase-based targeting, where ads are activated or suppressed based on whether someone actually bought the product—not just visited a website. You can build audiences around lapsed buyers, brand switchers, or promo responders and attribute campaign performance to literal in-store outcomes. Product-level purchase signals also unlock powerful new data monetization strategies.
Whether you’re selling lookalike models to DSPs, powering closed-loop attribution for retailers, or enriching first-party audiences with verified transactions, this kind of data bridges the gap between impression and impact.
4. Data Delivery Formats & Expectations
Don’t accept black-box dashboards and retrofitted CSVs. High-quality product-level data should be available in flexible formats designed for modern data ecosystems. Whether you need raw transactional logs, aggregated performance tables, or curated ticker-level summaries, delivery should support ingestion into cloud platforms like Snowflake, Amazon S3, or your internal data lake. File schemas should include fields like transaction date, UPC, quantity, spend, markdown amount, location, store ID, channel, brand, and mapped company or ticker. These datasets should be engineered for usability—with standardized keys, joinable metadata, and documentation that enables data science, not frustration.
5. Common Mistakes to Avoid
Even smart teams make mistakes when evaluating product-level data. Here are the most common pitfalls, organized by theme so you can audit your approach and avoid expensive missteps.
Mistake #1: Relying on Outdated or Infrequent Data
Many teams still rely on panel data that refreshes weekly or even monthly. This delay is a fatal flaw in high-velocity categories like beverages, snacks, or seasonal products, where pricing and velocity shift day by day. Data that lags behind real consumer behavior means missed trading windows, mistimed promos, and inaccurate forecasts. If your competitors are making daily adjustments based on real-time SKU data, and you’re waiting for panel reports with a 2–3 week lag, you’re already too late.
Avoid it: Insist on refresh rates of 1–3 days maximum. Anything slower is an operational liability.
Mistake #2: Missing Key Channels Like E-Commerce & Mobile
Omnichannel isn’t optional—it’s table stakes. If your dataset doesn’t include digital receipts, online order data, and mobile commerce platforms like Instacart, Amazon, or Walmart.com, you’re flying blind. These are not fringe sources. In many categories, especially urban and younger demographics, digital makes up the majority of volume.
Avoid it: Demand full omnichannel visibility. Cross-channel behavior is critical to forecasting demand and measuring campaign lift.
Mistake #3: Settling for Brand-Level Aggregates
Brand-level views may look clean, but they hide the actual decision-making behaviors happening at the product level. You’ll miss trends like shrinkflation, reformulated packaging, new flavor launches, and substitution behavior within brands. In today’s market, where trade-down is a defining force, these subtleties matter more than ever.
Avoid it: Insist on raw UPC-level visibility with full mapping to brands and categories. Granularity is what gives you leverage.
Mistake #4: Buying Data That Can’t Be Integrated
It doesn’t matter how rich your dataset is if you can’t use it. Many providers still deliver retrofitted dashboards or send clunky flat files that don’t match your internal schemas. If your data engineers need to spend weeks reverse-engineering the format, you’re burning time and budget.
Avoid it: Ask upfront about Snowflake support, API availability, schema docs, and onboarding support. Data that isn’t integration-ready is a tax on your team.
Mistake #5: Ignoring Segmentation & Context
Knowing that a product is selling is helpful. Knowing who is buying it—and how they behave—is transformative. Without segmentation by geography, household income, store type, or loyalty status, your data won’t tell you why a trend is happening. This weakens everything from promotional planning to inventory placement.
Avoid it: Look for datasets that include demographic or behavioral segmentation. At a minimum, ensure data can be enriched or joined with other customer attributes.
6. Glossary
UPC: Universal Product Code, a unique identifier used to track individual product units across retailers.
SKU: Stock Keeping Unit; a retailer-defined identifier that may differ from UPC.
TPR: Temporary Price Reduction, a short-term promotional discount offered at retail.
Velocity: A measure of how quickly a product sells, typically calculated as units per store per day.
Shrinkflation: A tactic where product size is reduced while price remains constant, effectively raising unit cost.
Trade-down behavior: When consumers shift to lower-priced or smaller-sized products in response to economic pressure.
7. FAQ
- What’s the difference between SKU and UPC data?
UPCs are standardized across retailers and manufacturers, making them ideal for clean cross-store analysis. SKUs are retailer-specific and harder to use outside internal merchandising systems. - How often should this data be refreshed?
For decision-makers who need speed, the benchmark is 24–72 hour refresh cycles. Slower updates miss inflection points and lead to lagging responses. - What channels should be included?
At a minimum, your dataset should include in-store, ecommerce, mobile app, and delivery fulfillment platforms. Bonus points for email receipt and loyalty card capture. - Is brand/ticker mapping necessary?
Absolutely. It unlocks the ability to benchmark competitors, track market share, and link product data to financial performance. - How much history is needed?
Anything less than two years limits your ability to benchmark against seasonality, inflation effects, or long-term promo trends. The more historical depth, the better your signal confidence.